The challenge
Every last Saturday of 2024, @Marcos Rayo and I walked one full metro line of Barcelona - above ground, on foot, stop to stop. No shortcuts, no metro rides. Just the streets.
By the end of the year we had covered all 12 lines of the network: ~200 km of city at walking pace.
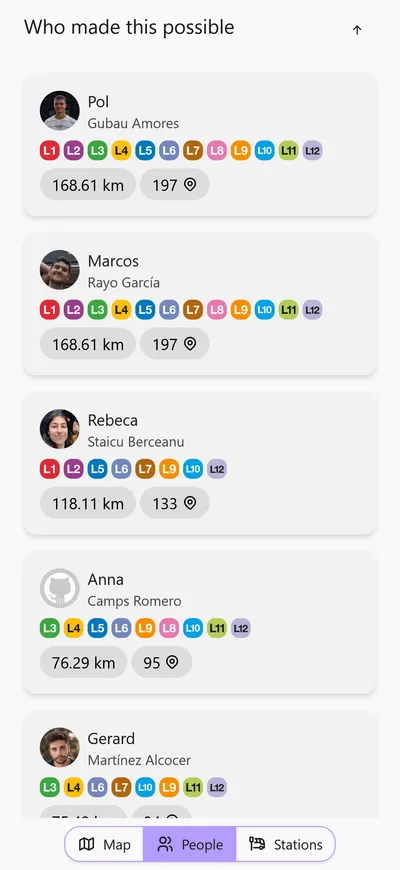
Friends joined on different dates - some for one line, some for several. Each Saturday ended up being its own thing: different neighbourhoods, different weather, and the shared goal of reaching the last station before the sun went down.
Engineering the routes
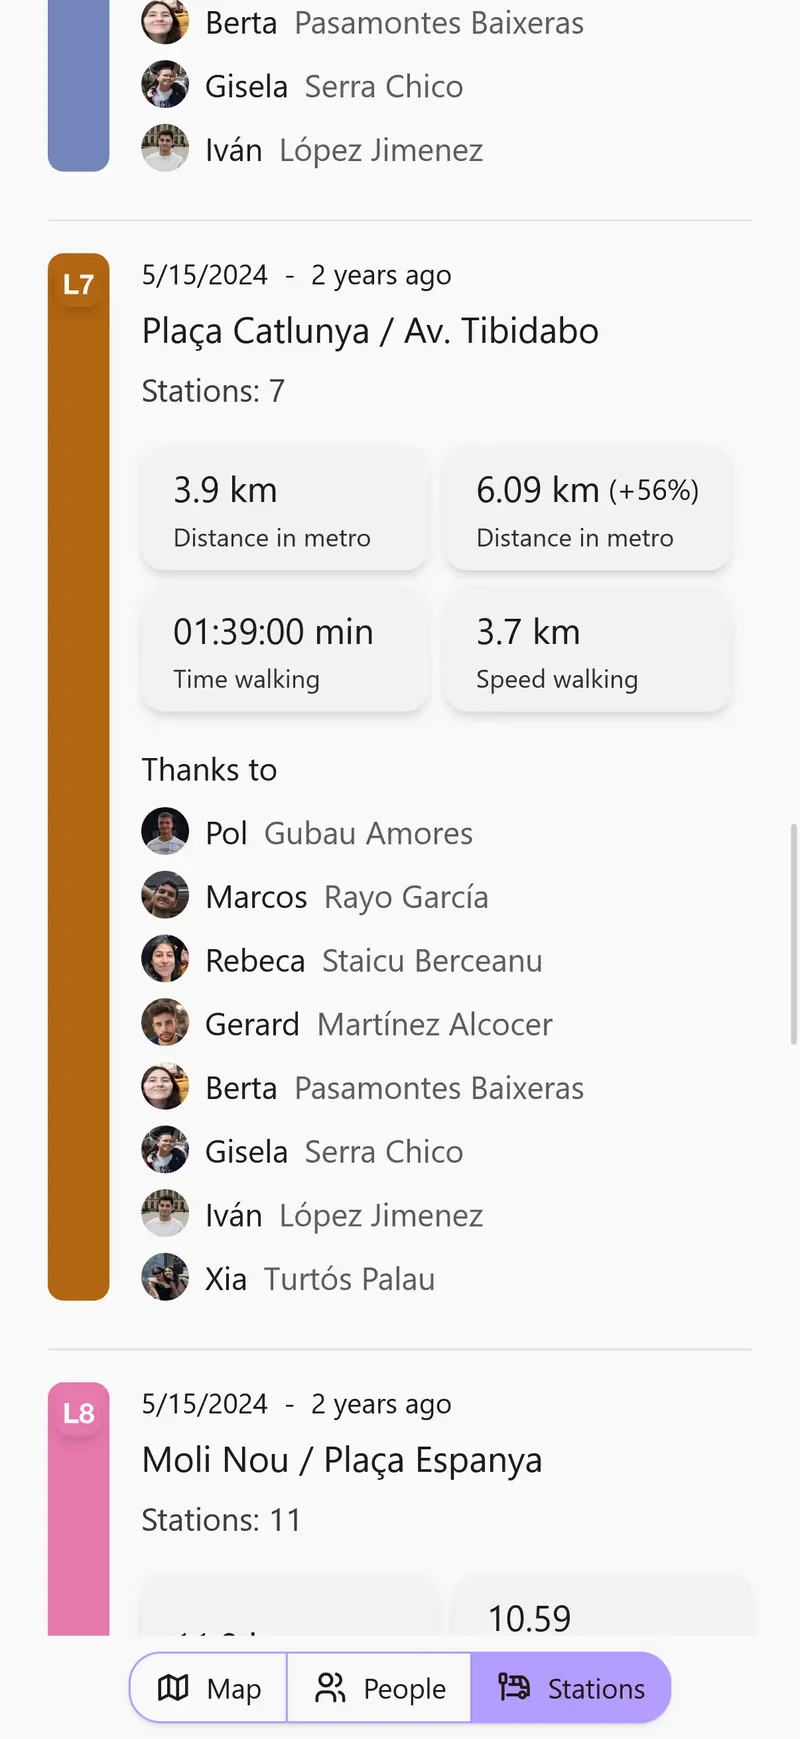
The goal was to document the whole thing - routes, stats, and the photos we took at each stop.
The data pipeline was the most interesting part:
- Recording: We tracked each walk on our phones.
- Cleaning: Exported GPX files were cleaned in GPX Studio to remove GPS drift and fix missing segments.
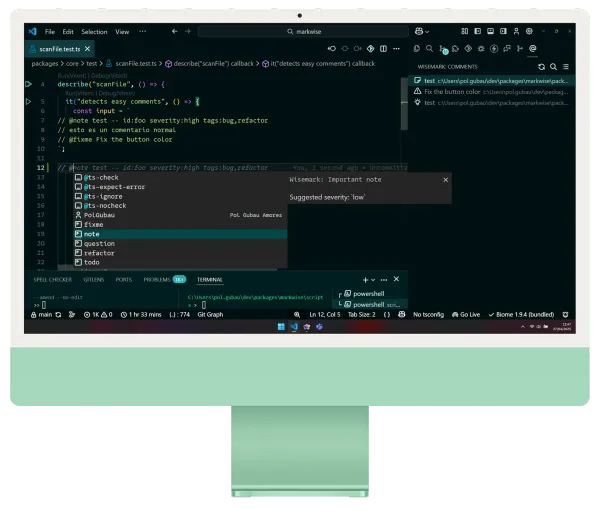
- Parsing: Converted to GeoJSON for the map, but also extracted metadata into a custom TypeScript structure to handle the UI.
{
  id: "L1",
  metadata: {
    title: "L1",
    subtitle: "Hospital de Bellvitge / Fondo",
    color: "#df2937",
    distance: 29.64,
    timeWalking: "06:56:45",
    stations: 30,
  }
}
Building the map
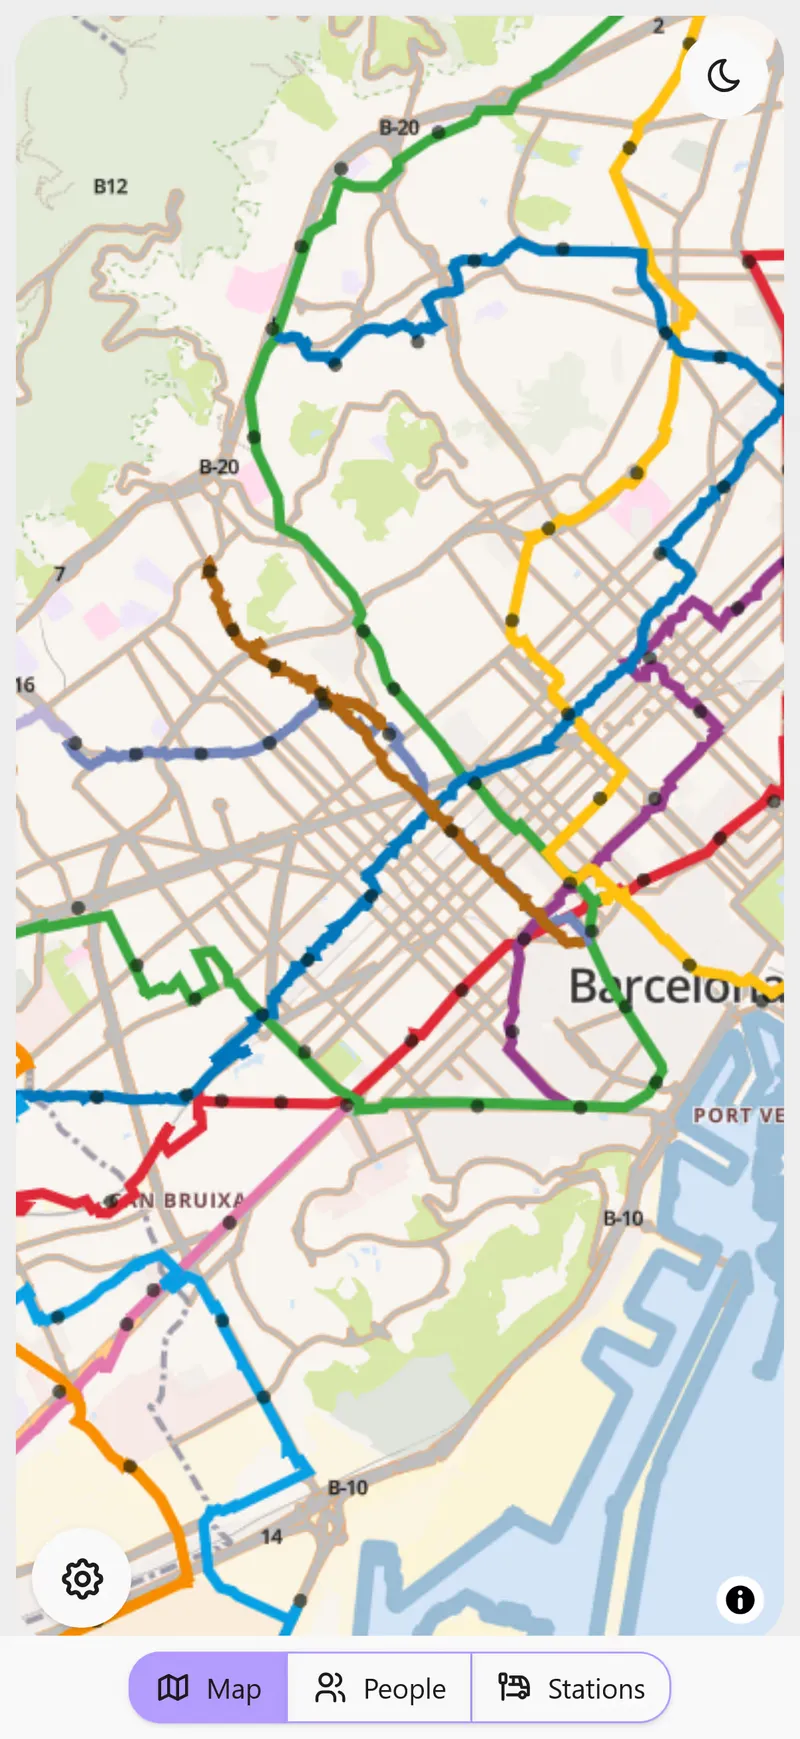
The map is built with MapLibre and React. Since it was a side project, I wanted to avoid Google Maps or Mapbox APIs to keep it completely free and privacy-focused.
I used @mapcomponents/react-maplibre, which was powerful but had almost zero documentation. I had to dive into the source code to understand how to handle layer interpolation - making the lines grow thicker as you zoom in to keep them visible.
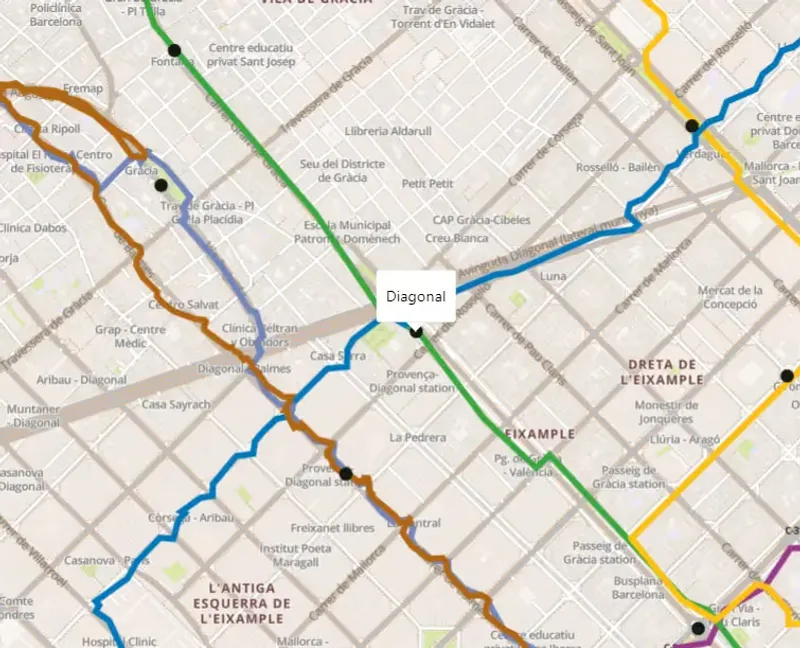
Selecting a line filters the global GeoJSON data and focuses the viewport on that specific route, showing the real-time stats extracted from the metadata.
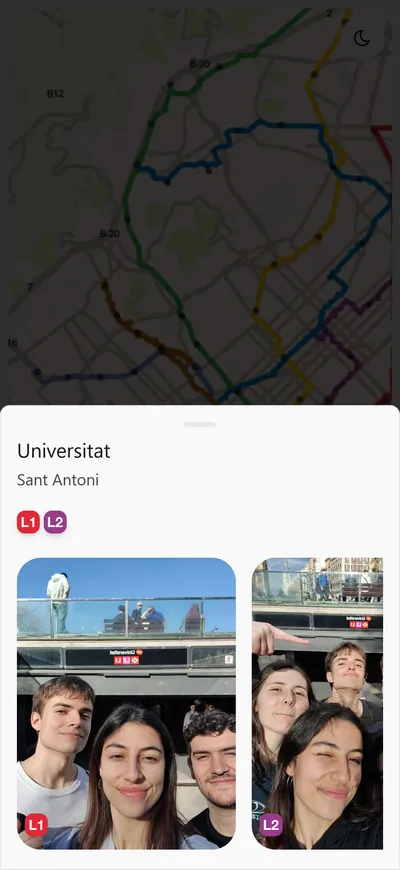
Stop photos
At every station we took a photo. It was the hardest part to automate: we have hundreds of photos named exactly like the station names.
Instead of a database, I opted for a simple naming convention. The app gets the clicked stop name, identifies the line, and dynamically loads the image from a structured public folder: /images/${line}/${stop}.jpg.
It’s a small project, but it captures 2024 perfectly: 12 Saturdays, 12 lines, and a lot of kilometers walked.
Links