Navigating a century of Barcelona theatre
The Arenas Explorer is an interactive knowledge-graph built on top of 564 glass-plate negatives photographed by Rafael Areñas between 1909 and 1935. The collection documents actors, playwrights, theatres, and companies across Barcelona’s modernist cultural scene - and it was entirely invisible to researchers until now.
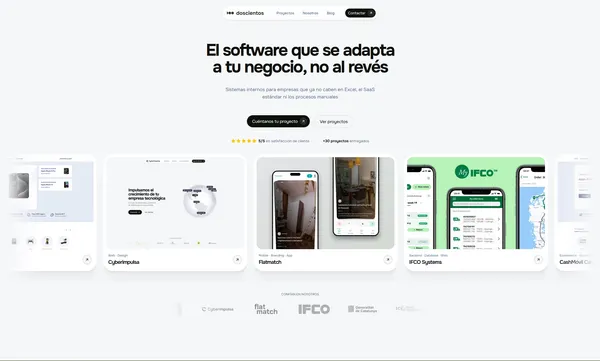
The project is the practical component of @Sara Gálvez Torres ‘s Master’s thesis in Digital Humanities at the Universitat Autònoma de Barcelona.
The Problem
Traditional archival catalogues treat photographs as isolated objects: who appears in them, when they were taken. What they cannot represent is the network. A single Areñas photograph is the intersection of an actor, a playwright, a theatre, and a company - relationships that existed but were structurally invisible in flat catalogue records.
Sara’s thesis identifies this as semantic dispersion: the information is there, but locked in disconnected rows. The challenge was to make those connections explorable without losing the fidelity of the original historical data.
Knowledge Graph
Instead of a relational database, I built a Knowledge Graph where each entity is a node and each documented relationship is an edge. Three layers of AI-extracted metadata enrich every photograph node:
- Estimated date - a computer vision model predicts the year of each shot with a confidence score.
- Costume detection - detected garments are indexed as separate nodes, enabling cross-era fashion queries.
- HTR transcription - handwritten annotations on the back of each plate are extracted via Handwritten Text Recognition and linked to the image.
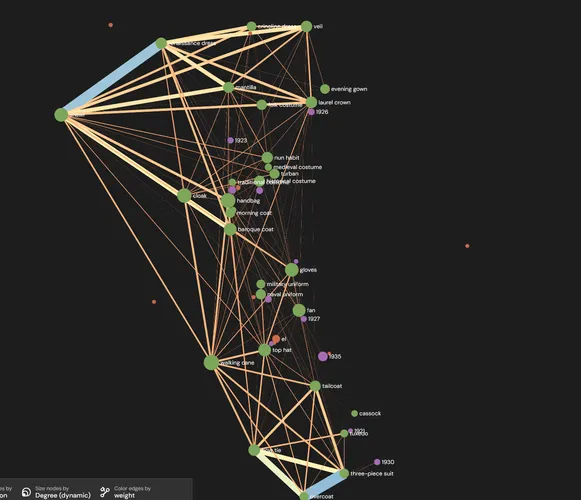
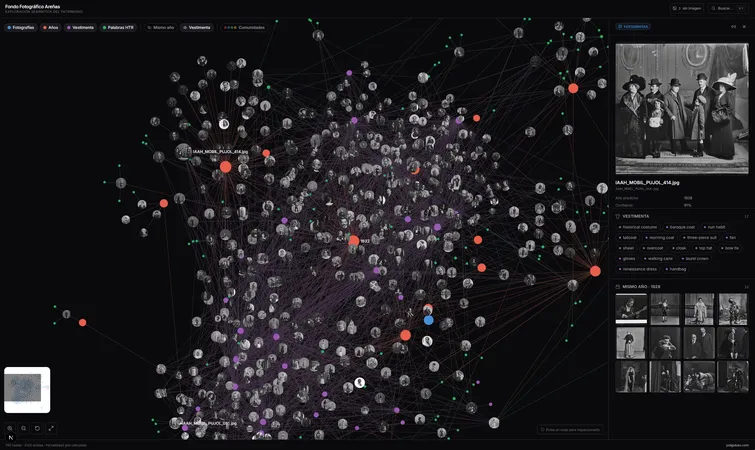
The result is a graph of 740 nodes and 4,120 edges that lets researchers navigate the collection by actor, year, costume, theatre, or keyword - simultaneously.
Technical Decisions
Pre-computed layout
Running a force-directed layout in the browser on 740 nodes is slow. Instead, ForceAtlas2 runs 500 iterations at build time over the source GEXF file and serialises final node coordinates to a static JSON. The client loads directly into the resolved constellation - zero layout cost at runtime.
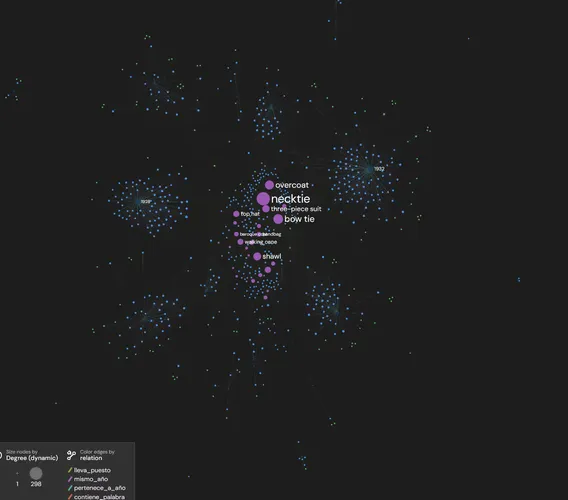
WebGL rendering
The graph renders through Sigma.js on a WebGL canvas. Each image node displays the actual photograph as a circular texture, letting researchers see the visual content of the archive without leaving the graph view.
Image proxy
The source images live on the Generalitat de Catalunya’s servers behind CORS restrictions. I implemented a Next.js API route that proxies image requests server-side, serving them transparently to the client without exposing credentials.
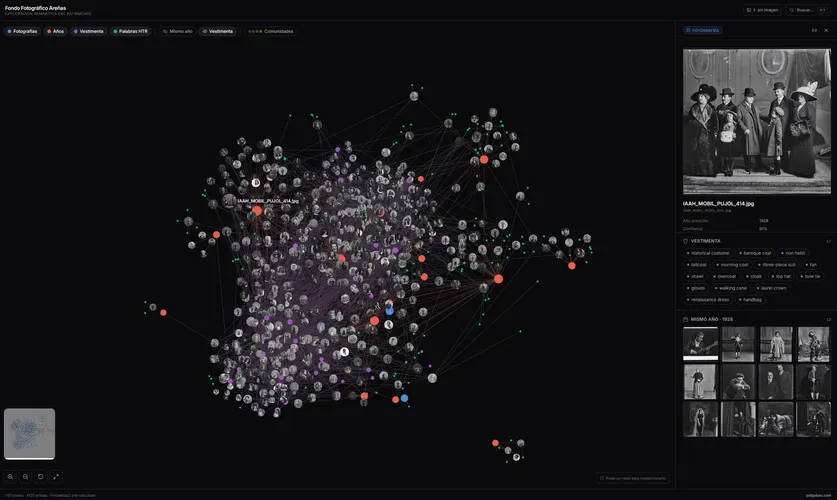
Interface
The app is a split-screen: the graph occupies the full left panel, the contextual detail panel lives on the right.
Clicking any node triggers a crossfade that loads the detail view - full photograph, predicted year with model confidence, detected garments, and a gallery of photographs from the same year. Clicking any item in the detail panel moves the graph camera to the corresponding node, keeping spatial context at all times.
Tech Stack
| Technology | Purpose |
|---|---|
| Next.js | Framework, API routes, static build |
| React + TypeScript | UI and type safety |
| Sigma.js | WebGL graph rendering |
| Graphology | Graph data model and algorithms |
| graphology-layout-forceatlas2 | Pre-computed node layout |
| TailwindCSS | Styling |
| Framer Motion | Panel transitions and crossfades |
| Sharp | Thumbnail optimisation pipeline |
Results
- 564 glass-plate photographs from 1909–1935 digitised and semantically connected
- 740 nodes - photographs, actors, playwrights, theatres, companies, years, garments
- 4,120 edges - explicit semantic relationships between all entity types
- 3 AI models - date estimation, costume detection, HTR transcription
- 0ms layout cost at runtime - all positions pre-calculated at build time